Productivity and 150 Years of Living Standards
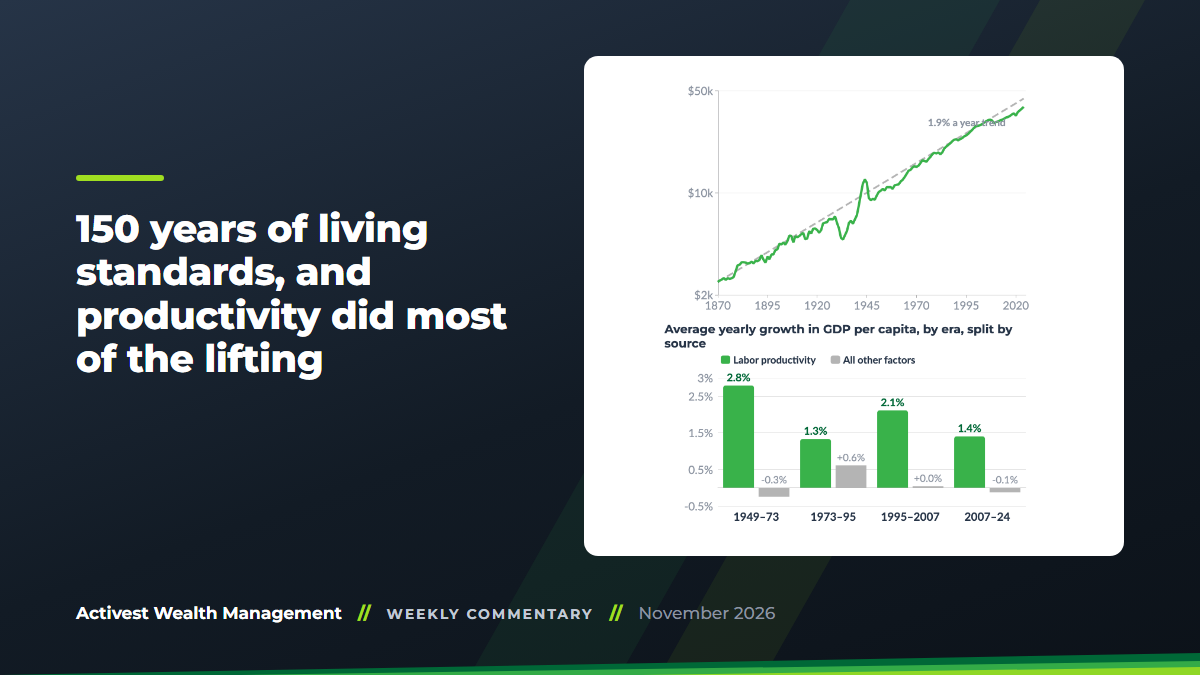
U.S. GDP per capita has grown a fairly steady 1.9 percent a year for over 150 years. Over long periods, productivity growth is the largest contributor.
Only labor productivity can in principle grow without limit
U.S. living standards have improved at a remarkably steady pace, according to the Federal Reserve Bank of Dallas. Measured by GDP per capita, they have risen at a fairly constant rate of 1.9 percent a year for more than 150 years. That steadiness held through World War I, the Spanish flu, the Great Depression, World War II, the Great Inflation, the Global Financial Crisis and COVID-19.
Higher GDP per capita can come from five sources. They are more GDP per hour worked, more hours per worker, a higher employment rate, increased labor force participation or a greater share of the population of working age. All but one of these are subject to hard constraints. The only one that can in principle grow without limit is labor productivity. Over long periods, the Dallas Fed notes, labor productivity growth is always positive and the largest contributor to higher living standards.
From 1949 to 1973, productivity grew rapidly, and living standards increased at an average annual rate just above 2.5 percent. That era ended around 1973 for reasons that are not fully understood, and low productivity growth lasted until about 1995. Computers finally started showing up in the productivity statistics around 1995, and faster productivity growth lasted until around the onset of the Global Financial Crisis in 2007. Since then, productivity growth has been relatively modest, closer to the 1973 to 1995 period, although there are some signs it may have begun to pick up in recent years. Any technology or innovation that increases productivity, the Dallas Fed concludes, promotes growth in living standards.
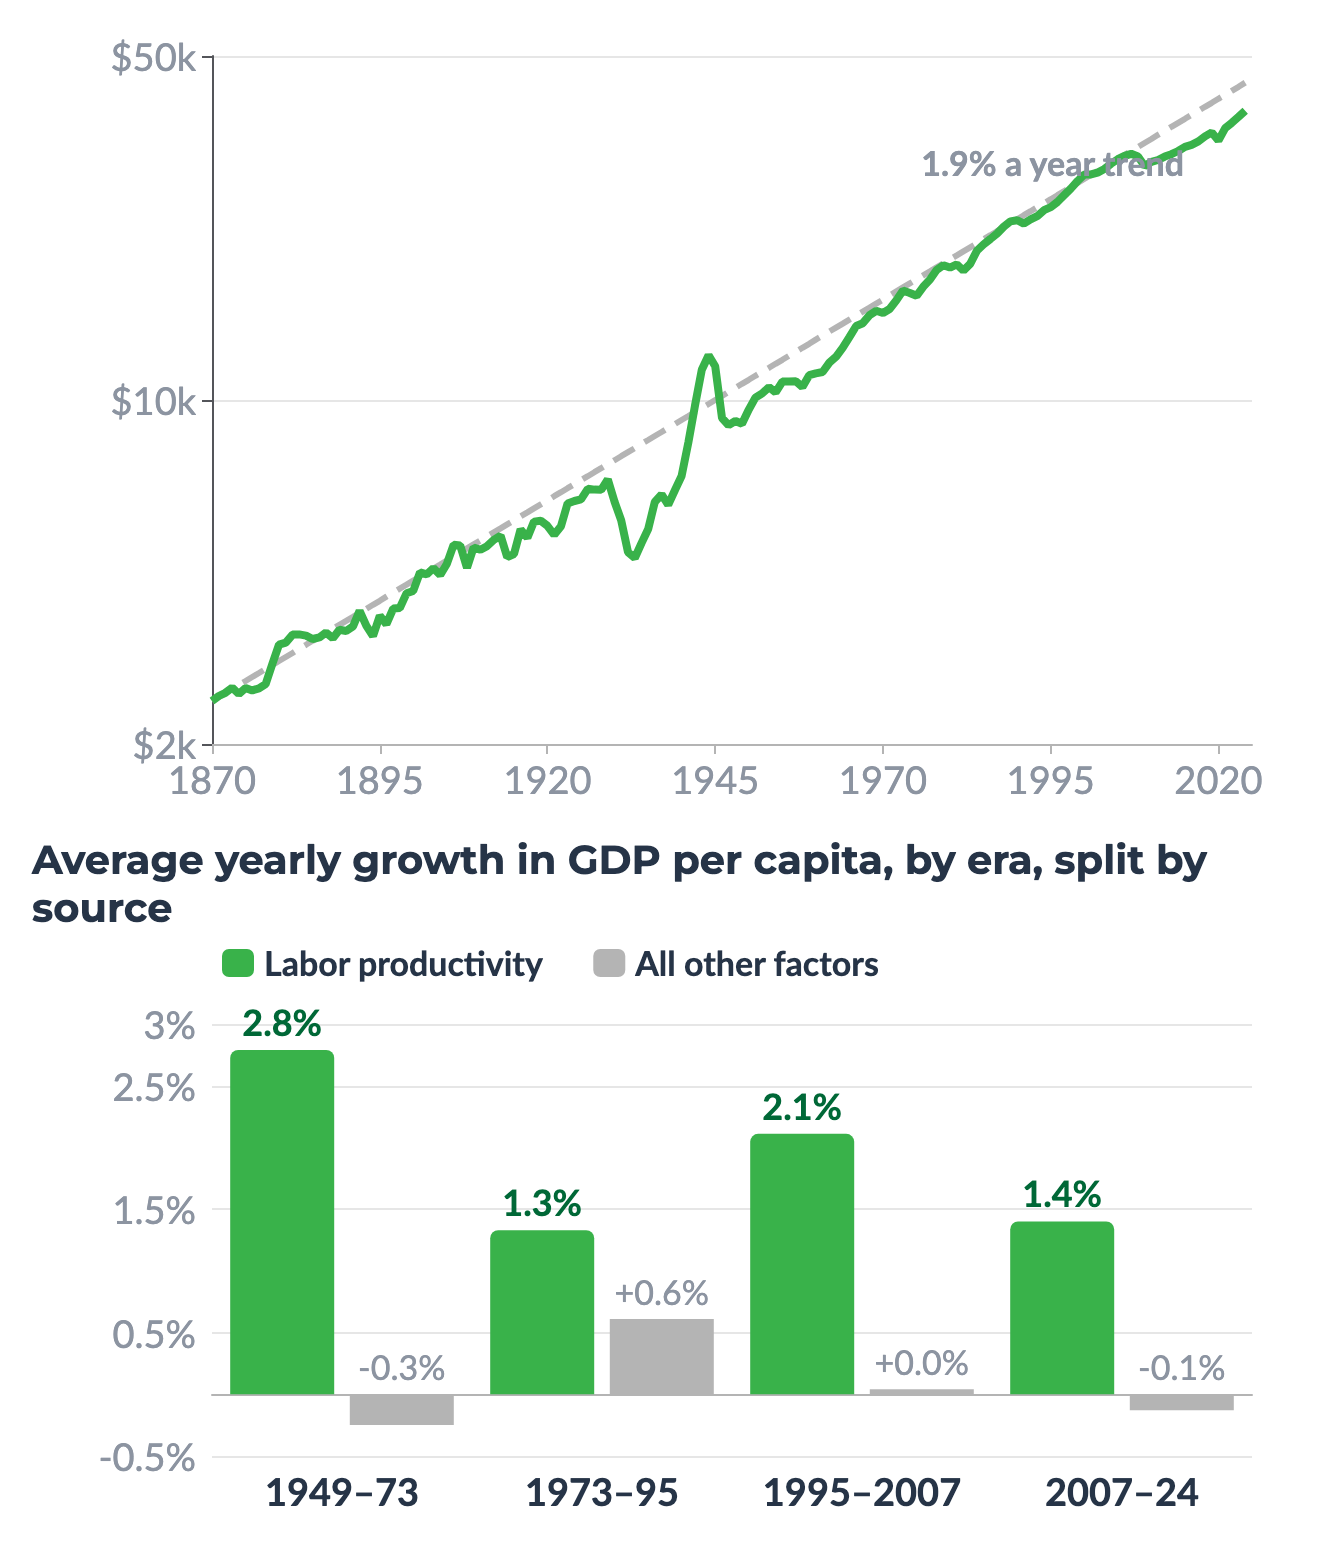
Source: Federal Reserve Bank of Dallas, “Productivity and 150 years of U.S. living standards”, September 29, 2026, chart data (Charts 1 and 3; Maddison Project data, BEA, BLS, Census Bureau). “All other factors” = hours per worker, employment rate, labor force participation and working-age share of the population, combined.
Activest Wealth Management, LLC is an investment adviser registered with the U.S. Securities and Exchange Commission; registration does not imply a certain level of skill or training. This material is provided for informational purposes only and does not constitute investment, legal or tax advice, an offer to buy or sell securities, or a solicitation of any offer. Information herein is drawn from sources believed to be reliable, but its accuracy and completeness are not guaranteed. Views are as of the date of publication and subject to change without notice. Index returns do not reflect the deduction of advisory fees or expenses, and you cannot invest directly in an index. Past performance is no guarantee of future results. All investments involve risk, including possible loss of principal. Please refer to Activest Wealth Management, LLC’s Form ADV Part 2 for additional information and risks. All market data as of the close on the date shown unless otherwise noted.