Activest Weekly | Week of October 19 to 23
Download the full report (PDF)
The Week in Brief
Meta plans to issue non-voting shares to help pay for its artificial intelligence (AI) buildout, and that brought back the question hanging over this year’s rally: how the industry will fund its data centers. Chipmakers and data-center contractors sold off, and investors moved into Treasuries, pulling the 10-year yield down 11 basis points to 4.99%. The S&P 500 ended the week little changed, as strong earnings lifted shares elsewhere.
Oil added a second source of pressure. Houthi attacks in Saudi Arabia lifted Brent crude, and fuel costs have already pushed inflation higher. The Federal Reserve (Fed) meets next week weighing another increase, although Thursday’s bond rally reduced bets on a move. Equity returns now depend on whether AI spending pays off, and energy keeps the risk of higher rates alive.
Three Things That Mattered
AI’s funding bill is back in focus Meta’s capital-raising plan showed that the AI buildout is starting to need outside money. Because index gains rest on a handful of big spenders, that question now sets the tone for equities.
Treasuries cushioned the sell-off Government bonds gained as AI-linked stocks fell, and the 10-year yield dropped 11 basis points. Balanced portfolios felt far less of the technology sell-off than the Nasdaq did.
Oil keeps inflation in play Attacks on Saudi Arabia pushed crude higher, so fuel costs stay high just as the Fed decides whether its September increase was enough.
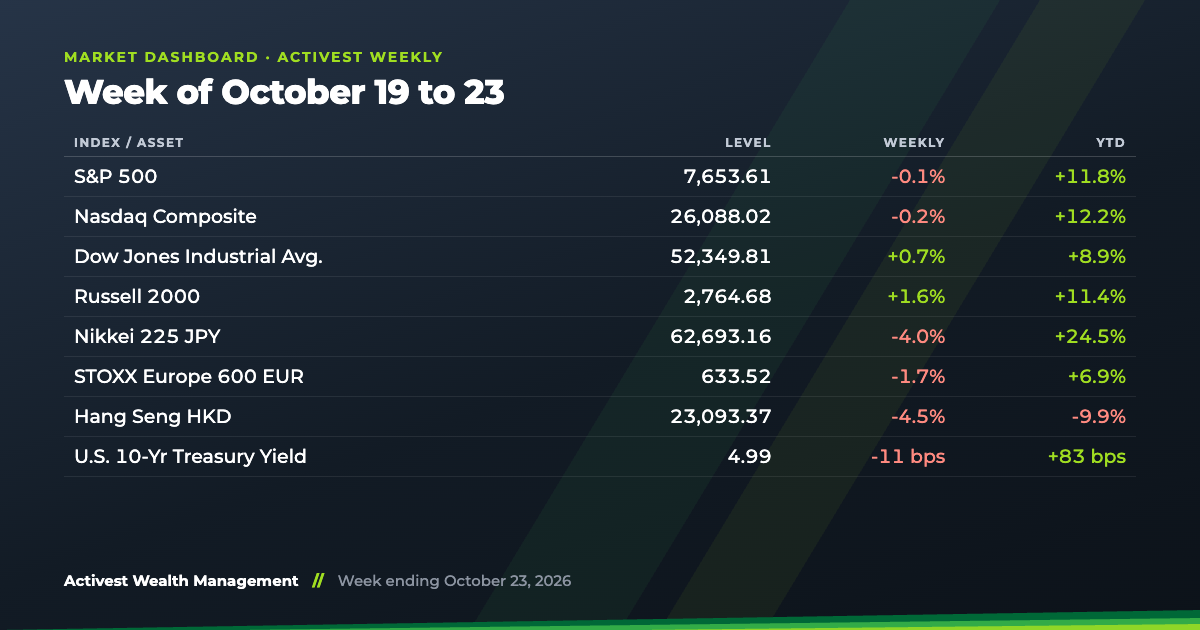
Market Dashboard
| Index / Asset | Level | Weekly | YTD |
|---|---|---|---|
| S&P 500 | 7,653.61 | -0.1% | +11.8% |
| Nasdaq Composite | 26,088.02 | -0.2% | +12.2% |
| Dow Jones Industrial Avg. | 52,349.81 | +0.7% | +8.9% |
| Russell 2000 | 2,764.68 | +1.6% | +11.4% |
| Nikkei 225 JPY | 62,693.16 | -4.0% | +24.5% |
| STOXX Europe 600 EUR | 633.52 | -1.7% | +6.9% |
| Hang Seng HKD | 23,093.37 | -4.5% | -9.9% |
| U.S. 10-Yr Treasury Yield | 4.99 | -11 bps | +83 bps |
| Brent Crude | 111.34 | +1.3% | +83.0% |
| Gold | 4,018.20 | -3.9% | -7.4% |
| VIX | 19.55 | -0.44 | +4.60 |
Weekly and YTD are price returns and exclude dividends. All figures are index and asset returns, not the performance of any strategy or client account. Yields in basis points, VIX in index points. Levels and returns in US dollars unless the row is marked with another currency; international indices are quoted in their own currency, so a US dollar result will differ with exchange-rate moves. Levels as at 11:00 AM New York, Friday, October 23, 2026; changes for markets still open then are not final, and closed markets are at their close. A dash means the figure could not be verified. Source: exchange and index-provider data; Cboe for Treasury yields.
Activest Wealth Management, LLC is an investment adviser registered with the U.S. Securities and Exchange Commission; registration does not imply a certain level of skill or training. This material is provided for informational purposes only and does not constitute investment, legal or tax advice, an offer to buy or sell securities, or a solicitation of any offer. Information herein is drawn from sources believed to be reliable, but its accuracy and completeness are not guaranteed. Views are as of the date of publication and subject to change without notice. Index returns do not reflect the deduction of advisory fees or expenses, and you cannot invest directly in an index. Past performance is no guarantee of future results. All investments involve risk, including possible loss of principal. Please refer to Activest Wealth Management, LLC’s Form ADV Part 2 for additional information and risks. All market data as of the close on the date shown unless otherwise noted.